Finally, we are here. Previously I've explained how to find the data, get it into a database, pull the annual data out and into Excel for graphing, and which dataset is the most reliable, and how to clean up the pre-1890 data. Time to see the results!
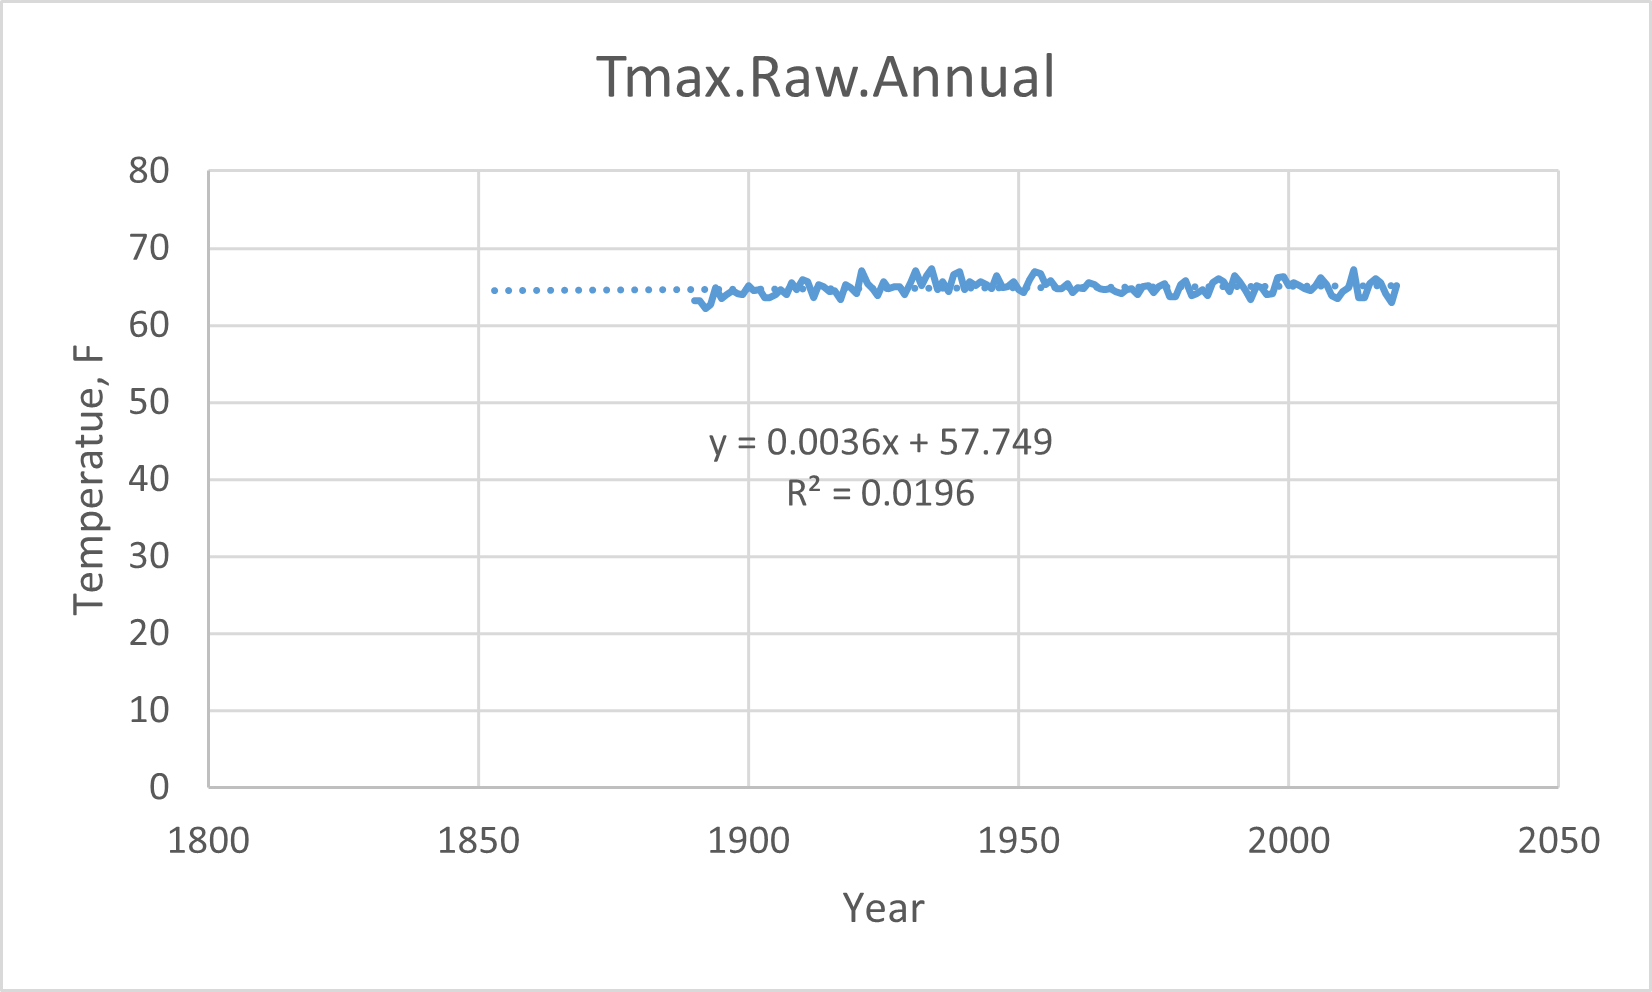
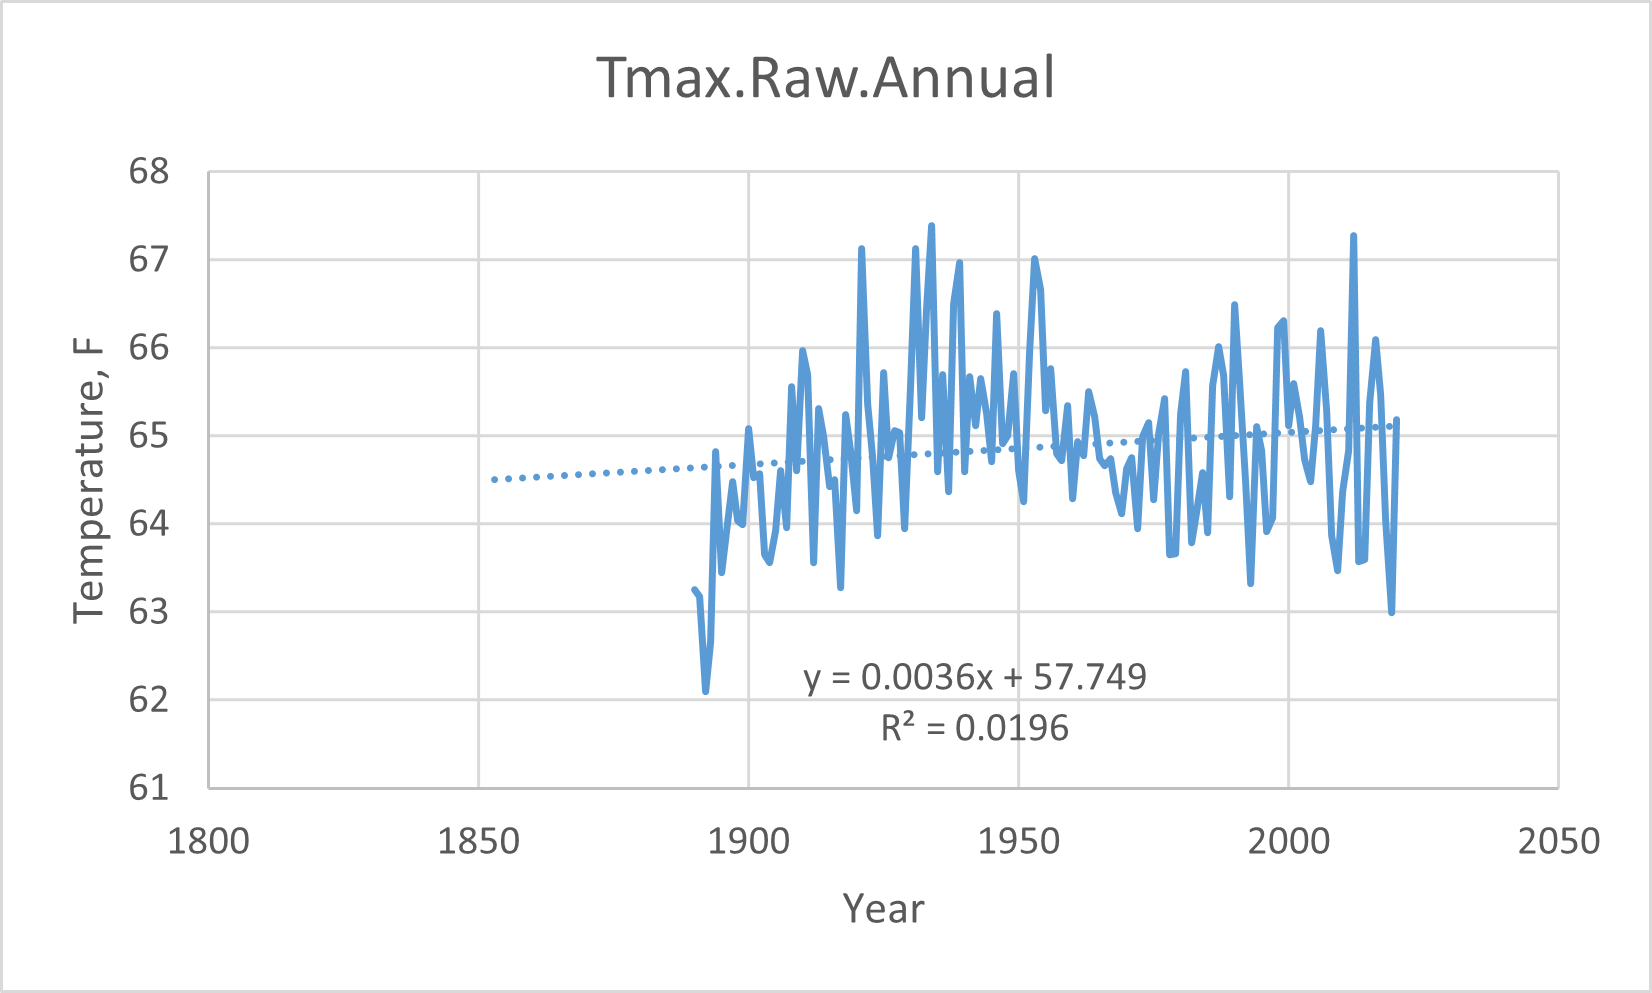
High temperatures each day going up at a rate of one degree F every 280 years (or one degree C every 500 years).

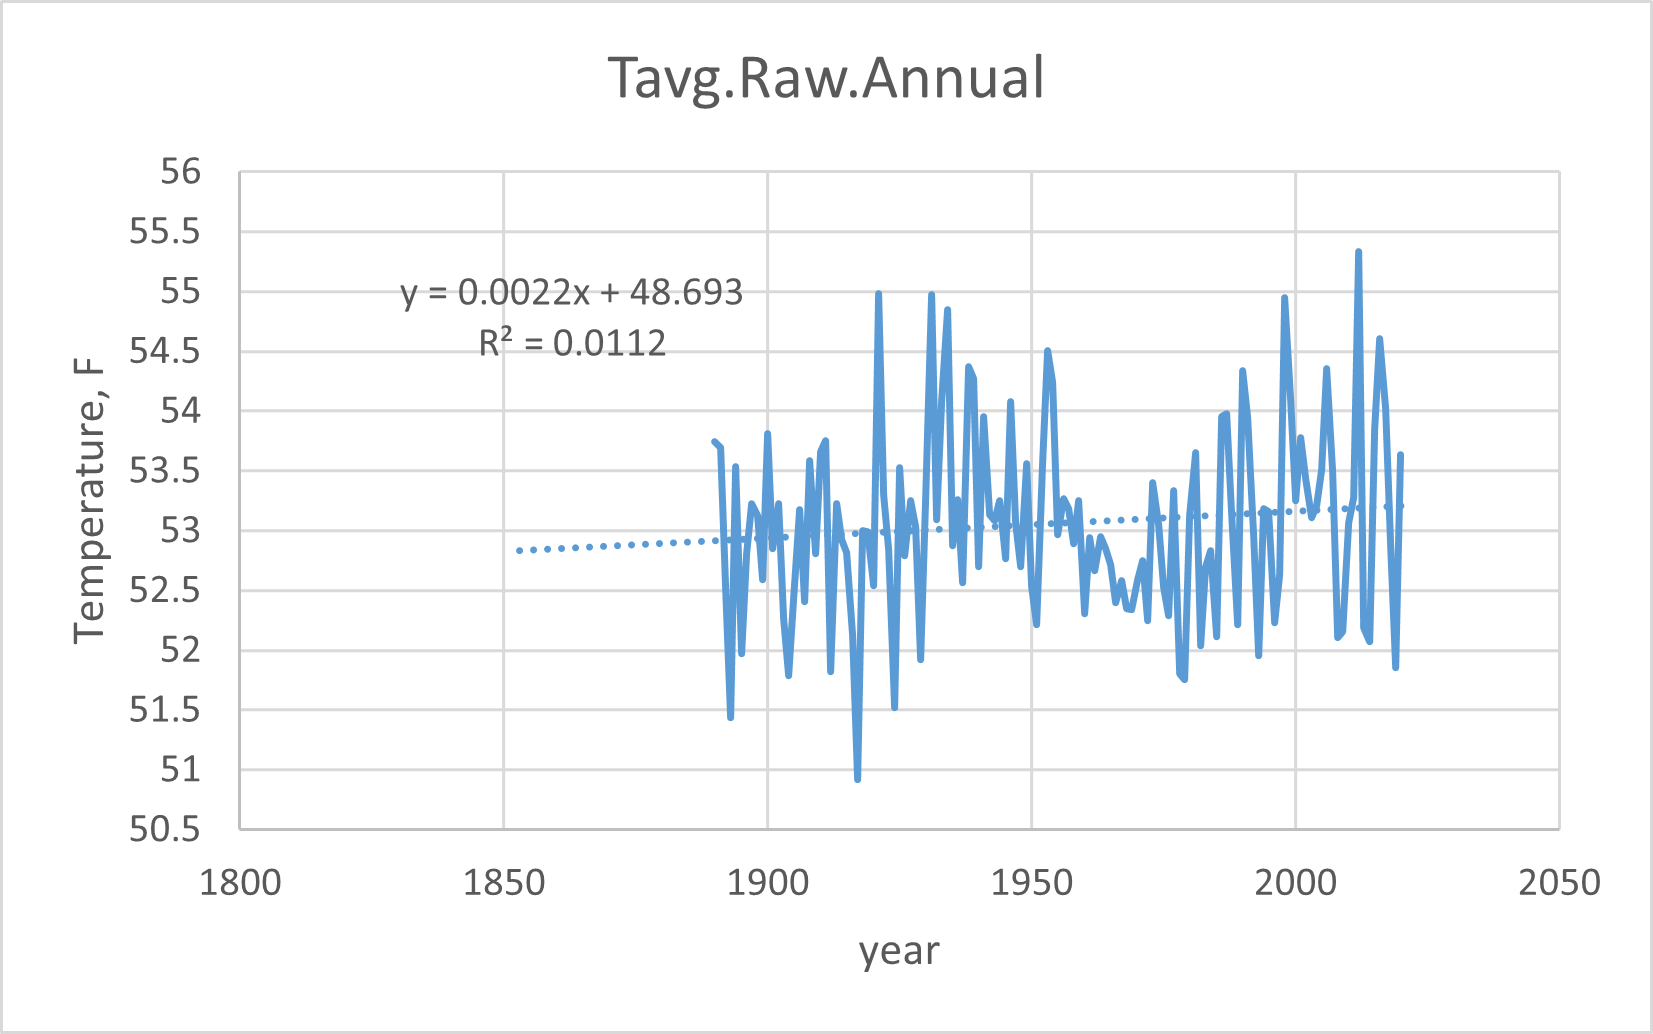
The average temperatures are going up at a rate of one degree F every 450 years (one degree C every 820 years).
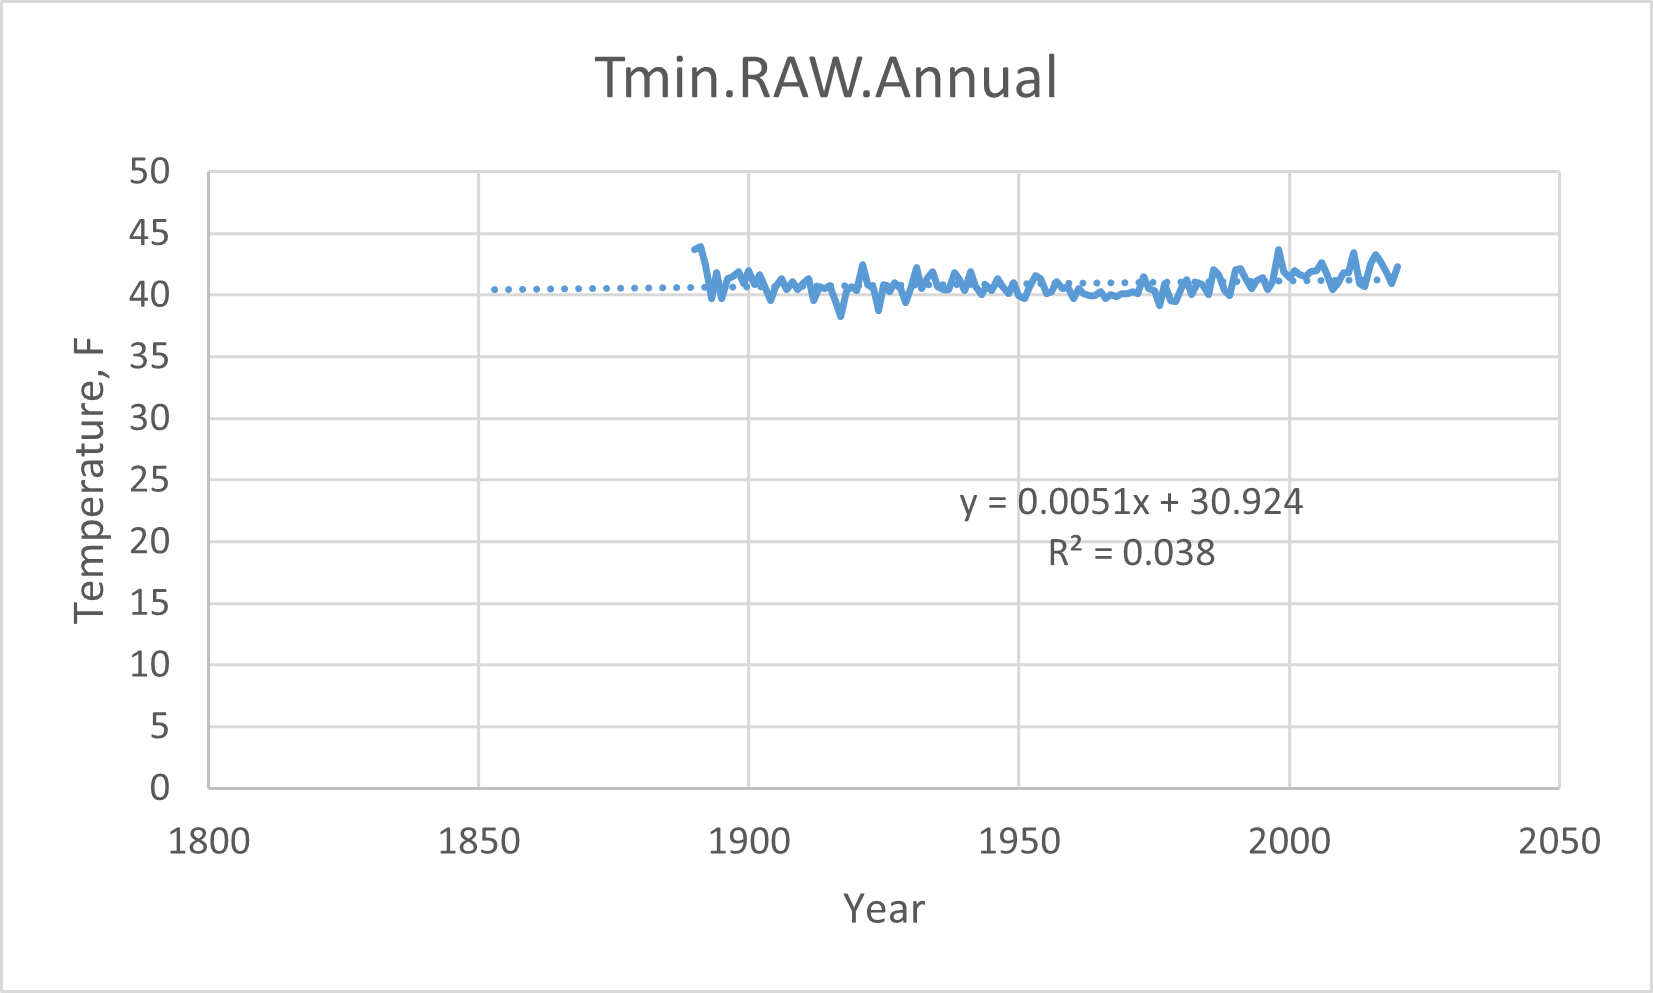
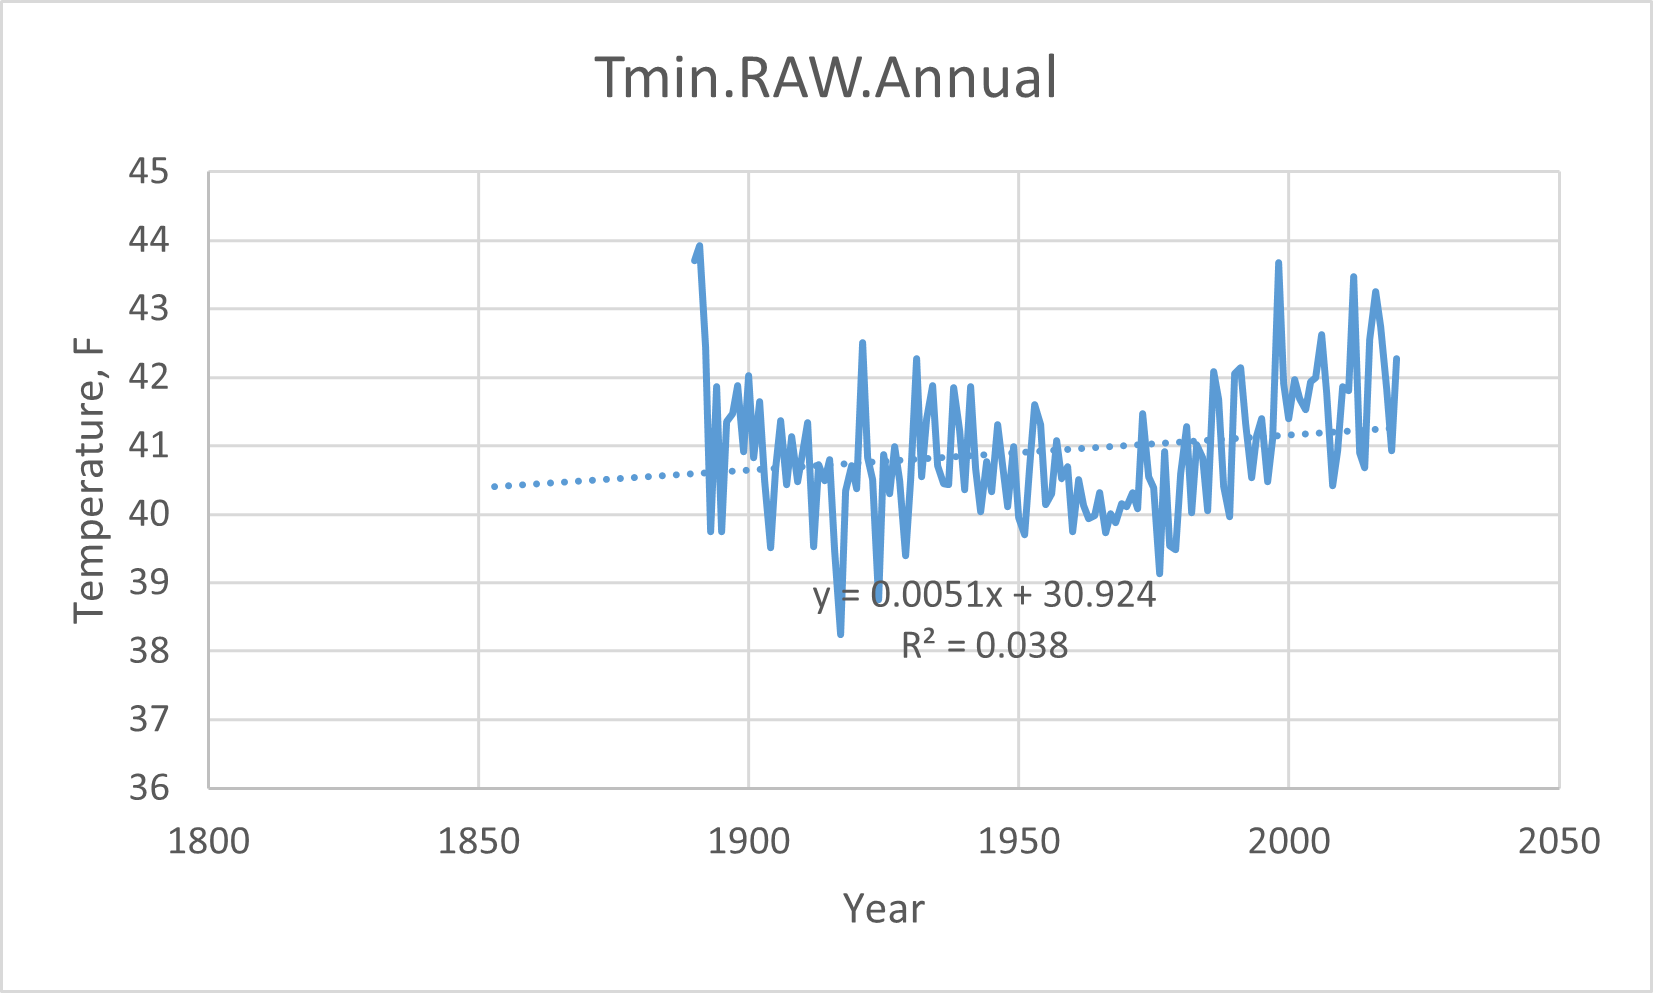
The low temperatures going up at a rate of one degree F every 200 years (one degree C every 350 years).
I probably should have bumped the cutoff up a few years, there are some big jumps at the beginning of two temperature trends.
Since the climatologists do this in degrees centigrade, so will I: averaged over the last 130 years,
- TMAX: +1 °C/500 years
- TAVG: +1 °C/820 years
- TMIN: +1 °C/350 years
So there you go. The US is warming very slowly.
You'll notice some graphs have a rising trend after 1980. Let's look into that. All the graphs show a very steady drop in the 1970's. That drop ended in 1977, and prompted the "coming ice age" scare I remember back when I was a kid. I'll use that as my starting point to calculate the trend from 1977 to 2020, the last 43 years:
- TMAX: +1 °C/6000 years
- TAVG: +1 °C/130 years
- TMIN: +1 °C/44 years
The high temperatures are flat, and the minimum temperatures are going up. The days aren't getting hotter, it's getting less cold at night! Summer days the same as they always were, and less snow and more rain during the winter. Nice! But the variability is returning to what we saw at the beginning of the 20th century. That's probably bad; I'm not sure, really.
By comparison, the last 43 years of the PHA data has:
- TMAX: +1 °C/36 years
- TAVG: +1 °C/36 years
- TMIN: +1 °C/35 years
Curious, if it was real. All the same number; an artifact of the PHA, no doubt.
And this completes the series. Thanks for reading!
That is the way of the scientist. He will spend thirty years in building up a mountain range of facts with the intent to prove a certain theory; then he is so happy with his achievement that as a rule he overlooks the main chief fact of all—that all his accumulation proves an entirely different thing.
— Mark Twain
'The Bee'. In What is Man? and Other Essays? (1917), p. 283
P.S. Again, this might be doable using a pivot table in Excel, but I know SQL better than I know Excel so that's the example you got.