Tony Heller, at RealClimateScience.com, has put up a very nice data website, RealClimateTools.com, to help us look at thermometer data over the years. He is using the raw daily thermometer reports (Tmax, Tmin, Precipitation, and Snow (not sure how that's measured, daily snowfall or total depth).
You can look up the data by station and move the graph around to do a graphical selection. For example, using my closest stations, Utah Lake Lehi and Spanish Fork Powerhouse Mountain, I can look at the average Tmax before and after 1970 when the carbon-driven warming is supposed to have started.
Utah Lake Lehi Before 1970 = 62.57 average, after 1970 = 62.82
Spanish Fk Pwr House before = 65.29 average, after 1970 = 64.83
Interesting, one 0.3 degrees higher, one 0.5 degrees lower. There is a lot more variability than the conglomerated data suggests.
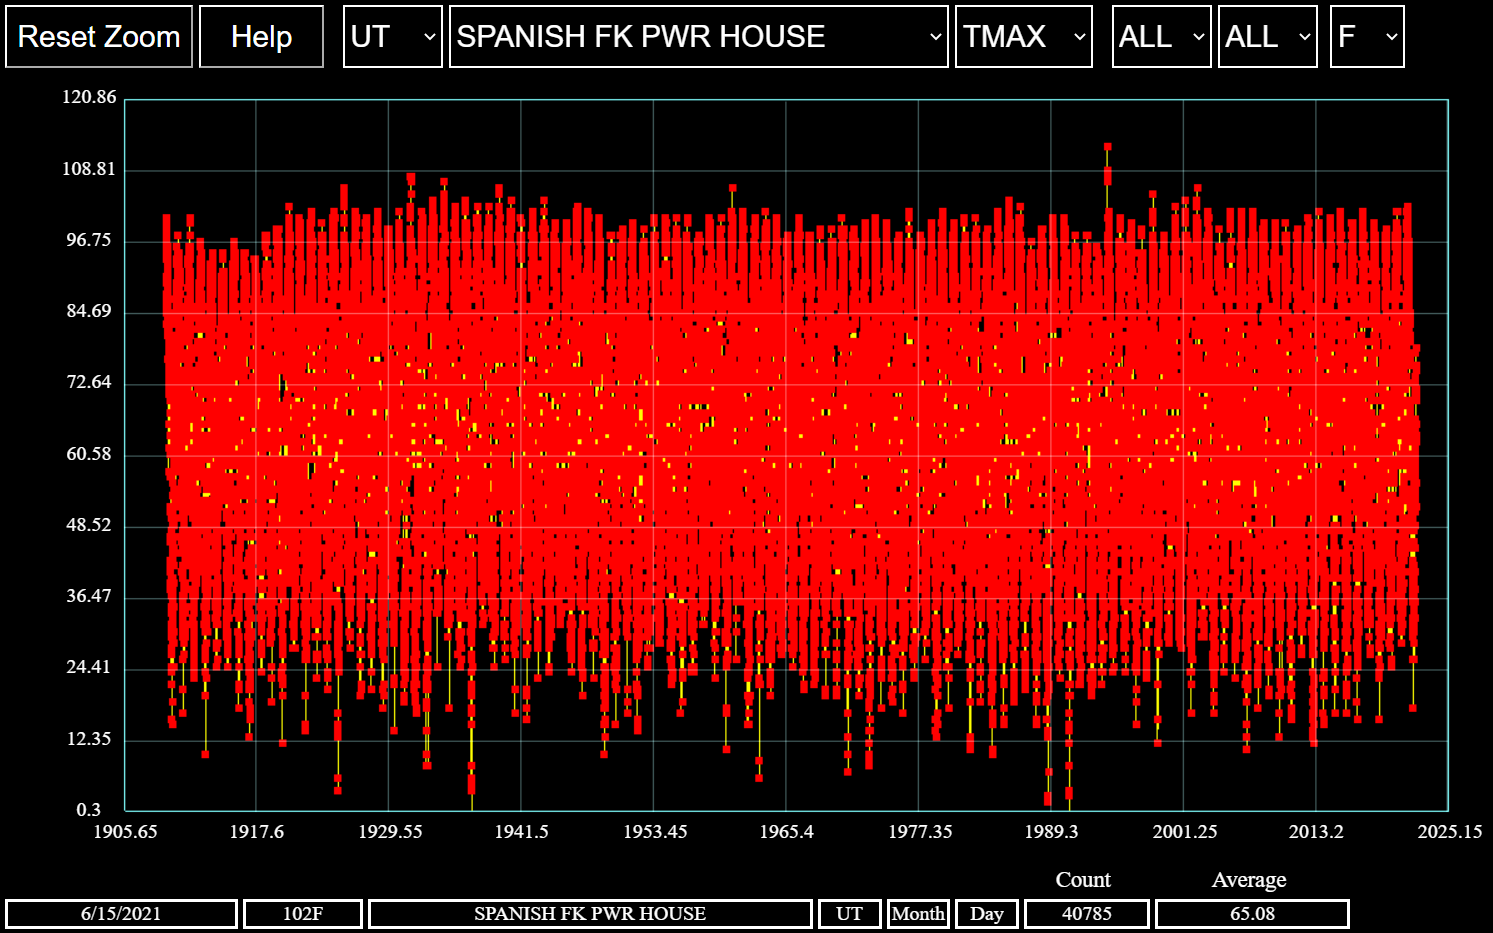
You can also examine the number of days above or below a certain limit by sliding the data up or down. At the Lehi station, the average number of days per year above 96 F has gone up from 3.4 to 6.0 a year after 1970. At the Powerhouse station the hottest days dropped from 20.0 to 17.7 a year.
I suspect Tony will be adding additional measuring tools over time, like trendlines, but it's fun to see the data, finally. It probably took him a lot of work to get it yup and running.
Thanks, Tony!